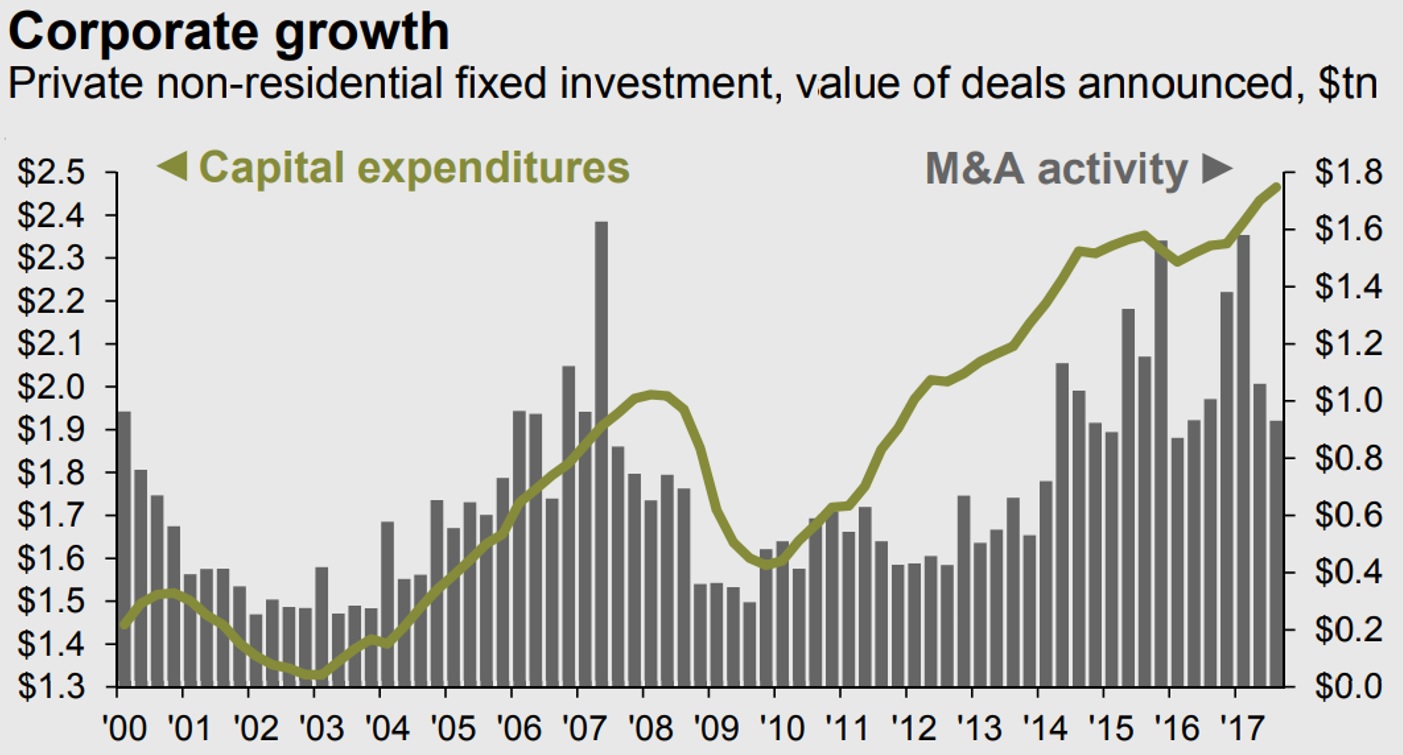
Corporate spending on M&A and capital expenditures (CapEx) is driving U.S. and Global economic growth.
- The chart is comparing amounts spent on CapEx and M&A activity, both indicators showing robust and confident reality.
- More and more CapEx funds are flowing to buy equipment, property, etc, indicating that corporate leaders are confident about the economy and financial markets.
- Current high corporate CapEx levels may add to manufacturing, industrial, technology solutions sectors’ growth levels, adding to revenues and profits.
- M&A activity, still at healthy levels, is slowing due to commonly accepted, at this point, full valuation of equities. Buying companies in M&A deals is more expensive now.
- High corporate M&A levels may add to equity valuations and corporate bond market strength.
- With every M&A deal, investors will have additional cash to reallocate to other investment categories, including real estate, private equity, alternatives.
____________
Why we Chart the Course? Charts speak a thousand words. They visually and concisely show economic, financial, and market trends. Charts help us build assumptions and conduct analyses for strategic decisions like exiting businesses, deploying capital, building investment portfolios, etc. In Charting The Course, we bring to your attention some of the charts we gather and analyze in our daily research and analyses of economy, business environment, investment and capital markets. We hope you find it of value.
_____________

