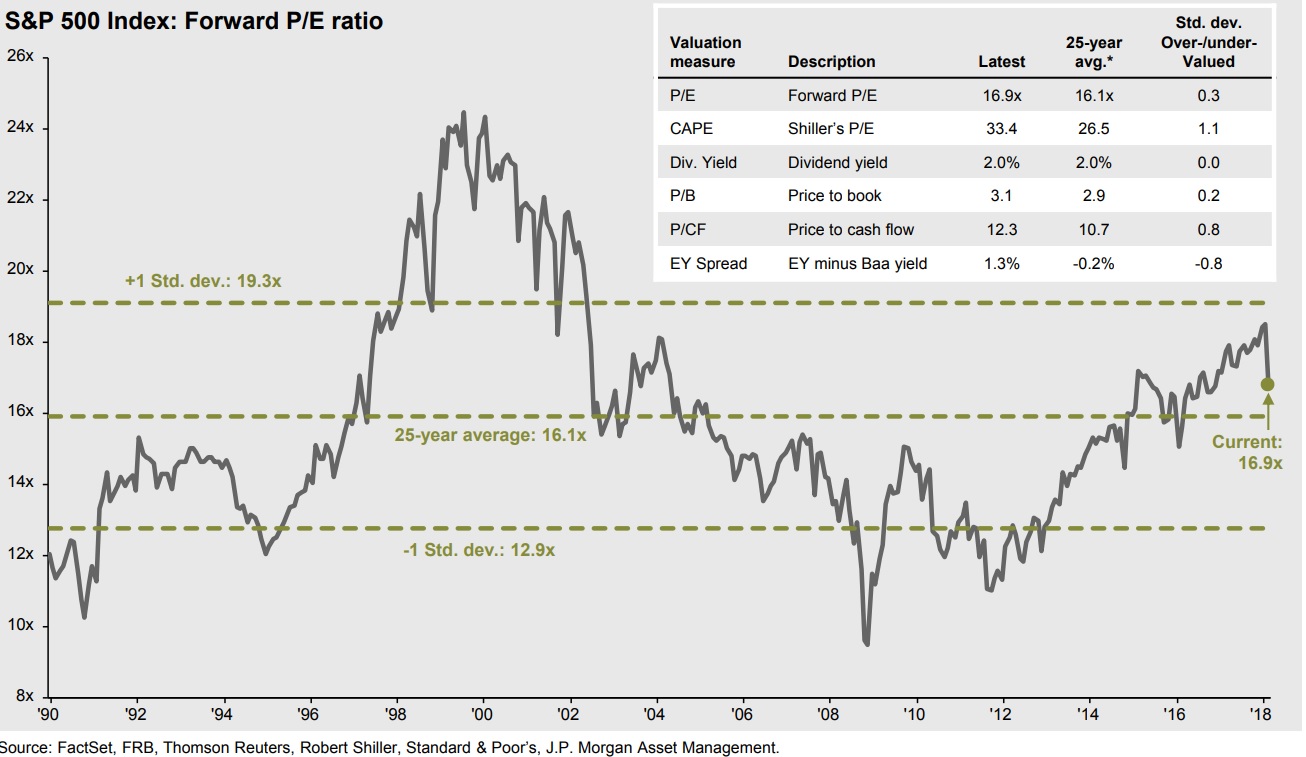
After a solid bull market, a key concern of many investors is – are the markets overvalued?
Lets look at the forward P/E ratio chart for the last 25 years. Following last few weeks of market adjustments – equities are just about average in valuations. The box, comparing other markets’ valuation measures, such real estate, bonds, etc, comes to the aid of equities – showing that equities, even higher valued than historically, are still a better long-term choice.
Sources: FactSet, FRB, Thomson Reuters, JP Morgan, Standard & Poors
____________
Why we Chart the Course? Charts speak a thousand words. They visually and concisely show economic, financial, and market trends. Charts help us build assumptions and conduct analyses for strategic decisions like exiting businesses, deploying capital, building investment portfolios, etc. In Charting The Course, we bring to your attention some of the charts we gather and analyze in our daily research and analyses of economy, business environment, investment and capital markets. We hope you find it of value.
_____________

