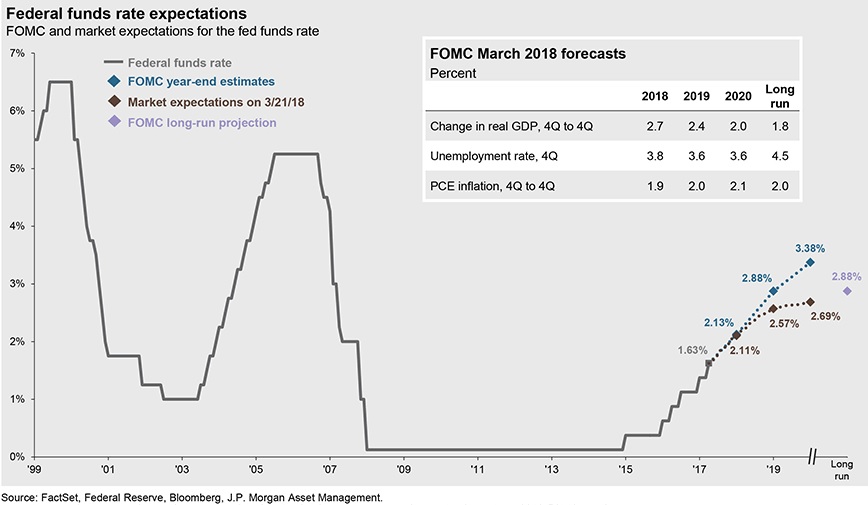
Rates moved steadily higher as financial markets gyrated in April.
- Yields on 10-year U.S. Treasury’s broke through the magical 3.0% threshold, up from 2.41% at the end of 2017.
- While that is noteworthy, the real story has been the rise in the front end of the curve.
- Yields on 2-year Notes reached 2.48% at the end of April, up from 1.88% at the end of December. With that, the on-again-off-again relationship with inflation was back on.
- San Francisco Federal Reserve President John Williams said, “I expect that we actually will see inflation not only reach but slightly exceed our longer-run 2% goal for the next few years.” Data were supportive of this view.
- Oil reached prices not seen since 2014 and steel and aluminum prices were also up significantly in advance of proposed U.S. tariffs, and gasoline is moving higher as well.
- Headline inflation, as measured by the consumer price index (CPI), now sits at 2.4% and core CPI has climbed to 2.1%.
- Annualized real GDP rose 2.3% in the first quarter, better than the consensus forecast of 2.0%, but down from the 2.9% in the fourth quarter. In spite of the slip, the trajectory of growth in the U.S. seems to be gaining speed.
Source: Federal Reserve, Janus Henderson Investors, Bloomberg, JP Morgan, FactSet
____________
Why we Chart the Course? Charts speak a thousand words. They visually and concisely show economic, financial, and market trends. Charts help us build assumptions and conduct analyses for strategic decisions like exiting businesses, deploying capital, building investment portfolios, etc. In Charting The Course, we bring to your attention some of the charts we gather and analyze in our daily research and analyses of economy, business environment, investment and capital markets. We hope you find it of value.
_____________

