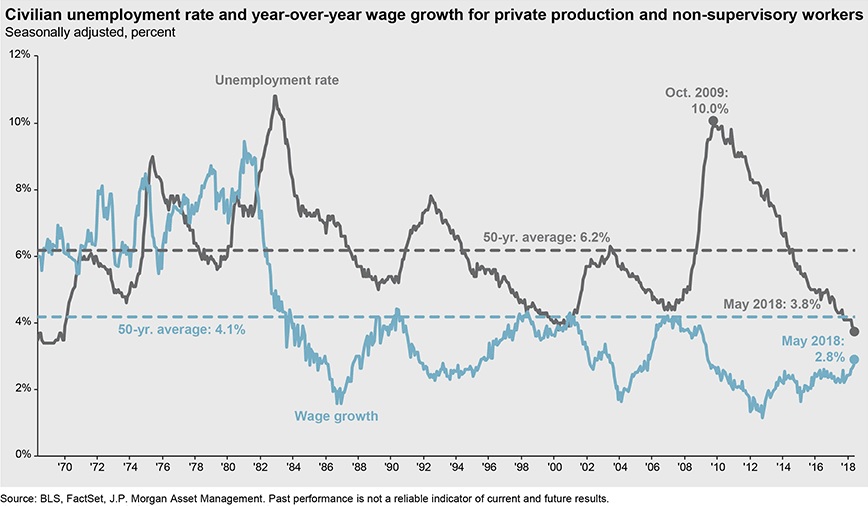
While the economy maintains a slow-but-steady pace of growth, the labor market has continued to tighten.
This reflects two key trends:
- Low productivity growth, which implies most GDP growth has to come from employing more workers, and
- Low labor force growth, which means that much of the job growth has come from re-employing the unemployed rather than new workers entering the labor market.
Solid GDP growth in 2017 and 2018 should cut the unemployment rate further, perhaps to 3.5% by the end of 2018, having already fallen close to 4% by the end of 2017. While wages have been slow to react to a tight labor market so far, extra pressure to find workers spurred by tax cuts could finally boost wage growth in 2018.
Source: BLS, FactSet, JP Morgan Asset Management
____________
Why we Chart the Course? Charts speak a thousand words. They visually and concisely show economic, financial, and market trends. Charts help us build assumptions and conduct analyses for strategic decisions like exiting businesses, deploying capital, building investment portfolios, etc. In Charting The Course, we bring to your attention some of the charts we gather and analyze in our daily research and analyses of economy, business environment, investment and capital markets. We hope you find it of value.
_____________

